The Gross Margin Staircase
Palantir's gross margin is 81%. Super Micro's is 11%. Both are "AI companies."
The difference is not execution. It is where they sit in the stack.
Where you sit in the stack determines the economics of your business.
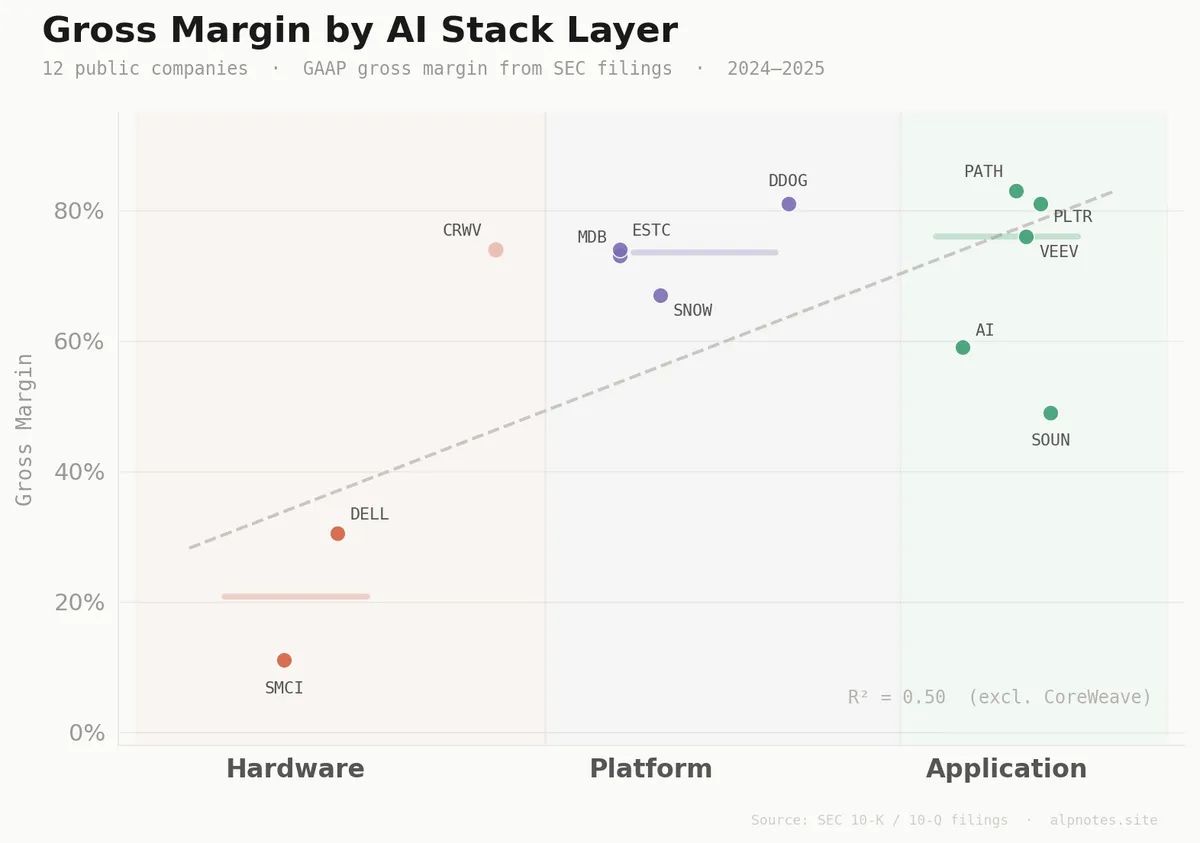
Plot a dozen public AI companies by stack position: hardware, platform, application. A staircase appears. Each layer up adds about 20 points of gross margin.Stack position alone explains half the variance (R² = 0.50).
| Company | Layer | GM % | EV/Rev | Growth |
|---|---|---|---|---|
| SMCI | Hardware | 11% | 1.7x | 47% |
| DELL (ISG) | Hardware | 31% | 0.7x | 9% |
| CRWV | GPU Cloud | 74% | 15x | 737% |
| SNOW | Platform | 67% | 17x | 29% |
| MDB | Platform | 73% | 10.5x | 22% |
| ESTC | Platform | 74% | 7.5x | 18% |
| DDOG | Platform | 81% | 18x | 28% |
| PLTR | Application | 81% | 112x | 63% |
| PATH | Application | 83% | 5.5x | 11% |
| VEEV | Application | 76% | 13x | 15% |
| AI | Application | 59% | 10x | 29% |
| SOUN | Application | 49% | 55x | 89% |
Median gross margins by layer: hardware ~21%, platform ~74%, application ~76%. That's a 55-point spread top to bottom.
The staircase holds. The valuation correlation does not.
DDOG and PLTR have the same 81% gross margin. DDOG trades at 18x revenue. PLTR trades at 112x. The difference: 28% growth vs 63%.
Same story one layer down; ESTC (74% GM, 7.5x) vs SNOW (67% GM, 17.5x). The faster grower gets the premium regardless of margin.
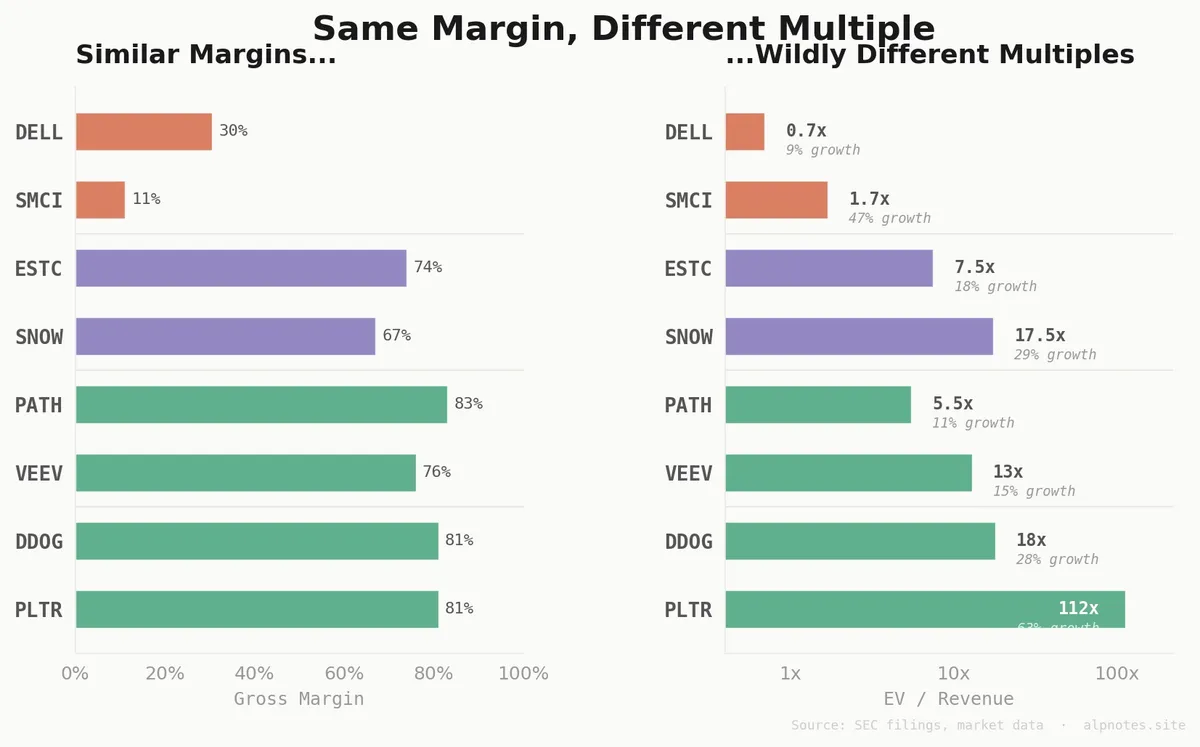
Stack position tells you your margin structure. Growth rate tells you your valuation. These are different questions with different answers.
The middle of the staircase is still private. Model API companies like OpenAI, Anthropic, and Cohere likely sit between platform and application, structurally in the 50–60% gross margin range. Until the S-1s arrive, that layer remains estimated.
Business model design is not just a technical decision. It is a margin decision.
— Yiğitalp Y.
Footnotes
Gross margins are GAAP, from the most recent 10-K or 10-Q filings through Q3 2025.
EV/Revenue multiples are approximate as of late 2025.
CoreWeave is excluded from the regression. Its reported ~74% GM reflects accounting treatment of GPU depreciation and is not directly comparable to traditional hardware peers.
Regression uses stack layer as an ordinal variable (Hardware = 1, Platform = 2, Application = 3). Results are illustrative, not causal.
Tickers referenced: SMCI (Super Micro Computer), DELL ISG (Dell Infrastructure Solutions Group), CRWV (CoreWeave), SNOW (Snowflake), MDB (MongoDB), ESTC (Elastic), DDOG (Datadog), PLTR (Palantir), PATH (UiPath), VEEV (Veeva), AI (C3.ai), SOUN (SoundHound).
Growth refers to most recently reported year-over-year revenue growth as of latest quarterly filing.